Senior Product Designer | Enterprise SaaS
LG Display vessel tracking
Operators required 6+ steps to detect shipment issues
Founding Product Designer · FNS · Q4 2024 – Q3 2025
FNS is a third party logistics provider supporting LG Display's global shipments. Operators track vessels across ports, terminals, and routes to detect disruptions. However, identifying a single issue required 6+ manual steps across fragmented GIS tools.
PROJECT OVERVIEW
Company
FNS (Enterprise logistics provider based in Los Angeles)
Client
LG Display
Shipment flow:
LG Display → Best Buy (US retail distribution)
Impact
Reduced investigation steps from 6 to 2.
Improved issue detection speed by 50%.

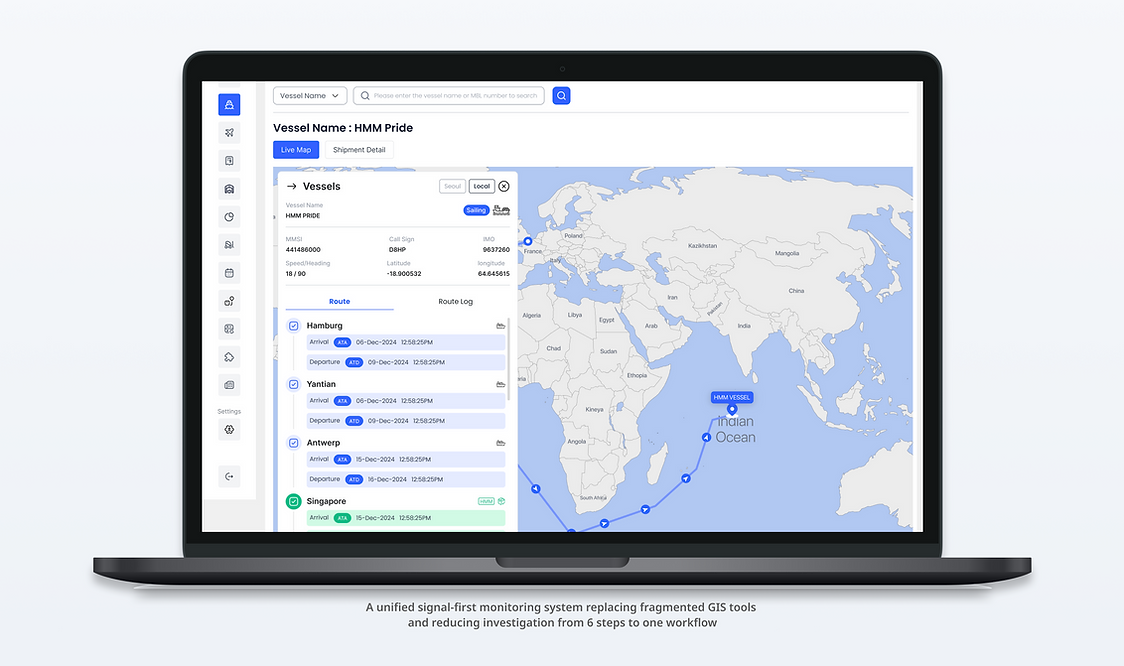
From Origin to Destination: Vessel History and Tracking Details
THE OVERVIEW
FNS is LG Display's primary tool for monitoring global shipments — from South Korean factories to US retail warehouses.
Operators coordinated shipments under tight timelines — tracking vessels across multiple GIS panels to detect delays, route changes, and delivery exceptions.
BEFORE AND AFTER
From fragmented workflows → real-time signal monitoring
BEFORE
01 Fragmented investigation workflow
Shipment data was scattered across multiple views and panels
AFTER
01 Unified shipment monitoring workspace
Signals were centralized into one interface

02 Low signal visibility
Critical issues were buried inside geographic context, making them difficult to detect quickly
03 Delayed operational response
Operators had to cross-reference spreadsheets to reconstruct shipment status delaying issue detection

02 Signal-first visibility
Critical issues were surfaced and prioritized
03 Faster operational investigation
A unified search interface replaced manual lookups operators could find and act on critical signals in one place.


THE PROBLEM
This forced operators to reconstruct context manually, delaying issue detection.
This resulted in:
— High cognitive load
— Delayed issue detection
— Inconsistent operational responses
BUSINESS ISSUES
Fragmented GIS tools created slow and inconsistent monitoring workflows.
USER ISSUES
Operators could not quickly identify critical shipment signals.
KEY UX INSIGHT
The system was optimized for geographic representation, not operational decision-making.
Recorded operator screen shares showed operators spent 70% of their time navigating, not deciding. This required redefining shipment monitoring from map navigation to signal driven decision making. Demoting the GIS map required aligning the head of operations and engineering lead. I reframed it from a product identity question to a workflow efficiency decision.
This created a mismatch between:
— System structure: map-centric
— User goal: signal detection and action

01. Destinations were not directly accessible
Critical issues were buried inside geographic context, making them difficult to detect quickly

02.Shipment status required manual lookup
Critical shipment details were buried inside vessel pop-ups — operators had to click each one individually to check status.

03.Critical signals were not directly accessible
Operators had to click through hundreds of vessel dots — no way to filter by urgency.
DESIGN HYPOTHESIS
The issue was not whether vessels were visible on the map,
but whether the right signals were surfaced at the right time.
Based on this hypothesis, I redesigned the system around signal-first navigation surfacing critical vessels and exceptions before operators had to search for them

Instead of making operators search through dense maps, the system should surface critical vessels and exceptions first, so they can assess and act faster.
DESIGN TRADE OFF
Trade-off: Geographic context vs decision speed
I explored whether the interface should preserve map prominence or prioritize operational speed. Keeping the map as the primary surface preserved geographic context, but it continued to obscure critical signals and slowed issue detection. I chose a signal first layout because operators needed to identify status changes and act quickly, with the map serving as secondary supporting context.

Option A: Map-centered layout

Option B : Signal-first layout ← Chosen
Preserved geographic context, but obscured critical signals and slowed decision-making. → Rejected
Decision:
Rejected because visibility and action speed mattered more than map prominence in this workflow.
Why this worked
- Improved discoverability of urgent signals
- Reduced scanning across multiple surfaces
- Supported faster operational response
Trade off
The map became supporting context rather than the primary interface
Prioritized critical signals, enabling faster issue detection and decision-making.
The Head of Operations wanted the map as the primary view. I brought observation data showing operators spent 70% of their time navigating, not deciding. That reframed it from a layout preference to a workflow efficiency decision.

DESIGN DECISION
I didn't just design the interface.
I defined the prioritization logic.
I chose signal-first layout over map-centered after testing with 5 operators. 3 out of 5 required multiple steps to triage issues in the map-first flow.

FINAL APPROVAL
A signal-first monitoring workflow
for real-time decision-making
This established a consistent decision model operators could use across shipment workflows. The final design operationalized the signal-first approach into a production-ready monitoring workflow. Instead of navigating across fragmented GIS views, the redesign shifted the system from a map-driven exploration model to a signal-driven decision system, enabling operators to detect and respond to issues without manual context reconstruction.
Critical shipment signals surfaced directly in the list
instead of being hidden inside map interactions
EDGE CASES
Operators can continue decision-making even when data is missing or partially available.
These edge cases were defined collaboratively with the engineering lead to ensure the system handled incomplete data gracefully, not just the ideal flow.
Edge Case: 01 No Data Found
When vessel data is unavailable, the system shows the last confirmed status with a timestamp so operators don't misread silence as "no issue."
Edge Case: 02 Revised Shipment Details
When shipment details update mid-transit, changes are flagged inline so operators can act without reopening the full record.
IMPACT & RESULT
From 6 manual steps to 2 — operators now detect issues in under a minute.
Restructuring how signals are surfaced transformed operational workflows and improved decision-making at scale. This reduced reliance on individual operator expertise and made the system more scalable across different teams and use cases.
6 →2
Investigation steps
50%
Faster issue detection
4 → 1 min
Issue detection time
Based on recorded operator screen shares during prototype validation.