Senior Product Designer | Enterprise SaaS
PFIZER DIGITAL COMMAND CENTER
Five teams couldn't agree on what "critical" meant.
I defined the decision system, not just the dashboard.
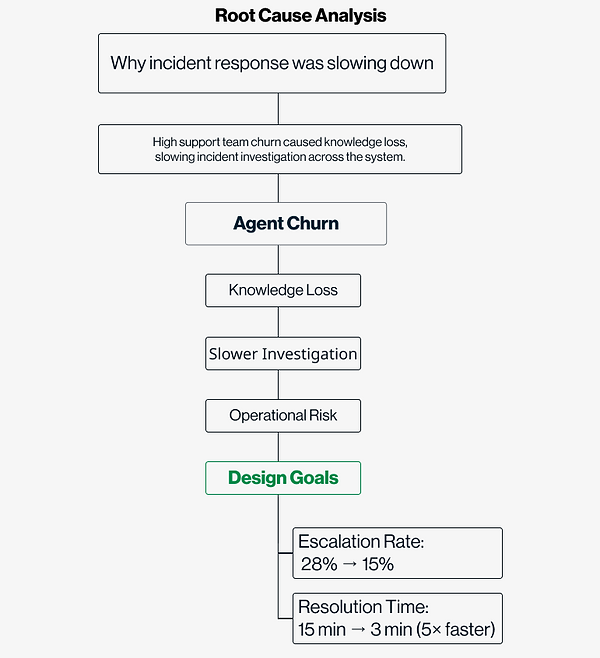
Pfizer's vaccine delivery operations broke down not because data was missing — but because no one had defined what required action.

PROJECT OVERVIEW
Platform & Timeframe
Web application
Enterprise operations dashboard
Duration: 2024–2025
Role
Senior Product Designer.
End-to-end ownership from research to production.
Defined the alert prioritization framework adopted across 5 operational teams
Note
Due to NDA restrictions, some confidential details have been omitted or generalized. This case study reflects my design process but does not represent Pfizer or IBM official documentation.
THE BACKGROUND

Pfizer's global vaccine operations relied on 8+ fragmented monitoring tools.
AI-assisted incident monitoring for Pfizer's global vaccine operations
THE PROBLEM
The data was available. The decision logic wasn't.
70%
Support churn
within first year
30min
Investigation per incident
1 → 8
Dashboards required to investigate 1 ticket
8+
Monitoring tools
→ Investigation failures were not caused by lack of data, but by unclear decision logic across fragmented systems.
Screen share observation sessions
Over 70% of support agents left within their first year.
Those who stayed couldn't act fast enough — incident context was fragmented across multiple dashboards with no clear priority signal.

USER IMPACT
Support agents spent over 30 minutes
just to understand the context of a single incident.
Source: Stakeholder interview (SRE Director)
I reframed this problem from information visibility to decision clarity.
The issue wasn’t the lack of data. It was the inability to identify the right signal at the right time.
01
Agents received thousands of email alerts — most had nothing to do with their work
02
Finding a specific ticket took over 30 minutes due to information overload
03
No live data meant no trust — people hesitated and delayed action.
TRADE OFF
Design tradeoff: Data Integrity vs Data Velocity
I evaluated multiple approaches and prioritized decision speed over data completeness.
Stakeholder workshops and incident workflow analysis revealed a key tension in the investigation process. Support engineers needed accurate records, but during incidents their primary need was speed in locating critical signals across multiple systems.
I prioritized decision speed over data completeness to reduce investigation latency

OPTION A - FORM REFACTORING
User Impact: ★★★
Business Value: ★★
Feasibility: ★★★★
Engineering wanted Option A: AI-Assisted Form Refactoring. Safer to build. Cleaner long-term data. Lower integration complexity. It also doesn't reduce investigation time.
Pros
• Improves long-term data quality
• Maintains existing workflow
• Easier to implement
Cons
• Does not reduce investigation time
• Engineers still search across dashboards

OPTION B - SIGNAL FIRST WORKSPACE ← CHOSEN
User Impact: ★★★★
Business Value: ★★★★★
Feasibility: ★★
During active incidents, the cost of delayed action far exceeds the cost of imperfect data. We can reconcile records post-incident. We cannot recover from a missed escalation.
Pros
• Faster signal discovery
• Reduces dashboard switching
• Improves investigation speed
Cons
• Requires multi-system integration
• Higher engineering complexity
Final Decision : Signal Prioritization Rules
SRE pushed back on timeline and integration complexity. I came back with observation data — engineers were spending 30 minutes just finding the right ticket. That reframe shifted the conversation from 'should we' to 'how do we.
Although Option B had lower technical feasibility, we prioritized investigation velocity over perfect data structure. During incidents, enabling engineers to locate critical signals quickly was more valuable than maintaining ideal data formatting. The "Due" timestamp model shows when data was confirmed and preserves accountability without requiring real-time accuracy guarantees.

The most consequential decisions were about what the AI surfaced and when — not just the layout around it.
THE SOLUTION
Externalizing decision logic in incident investigation
I designed a rule-based system to externalize decision logic. I redesigned the incident investigation workflow so support agents could identify critical alerts without switching across dashboards. This shifted the product from a monitoring dashboard to a decision-support system. Teams no longer spent time searching for context — they could act immediately with confidence.
01. Clear alert prioritization
02. Reduced information noise
Filters and ranks alerts based on defined criteria, eliminating irrelevant notifications and reducing alert fatigue
Surfaces only relevant signals in a single view, removing the need to search across fragmented data
03.Reliable real-time visibility
Provides continuous updates to ensure data is current, increasing trust and enabling faster response

BREAKING DOWN THE PROJECT
How investigation decisions changed across systems
Teams struggled to make consistent decisions due to fragmented signals and unclear prioritization logic
BEFORE
01 Alerts not ranked by relevance
Critical incidents were not surfaced clearly, and notifications were not ordered by recency.
02 Data scattered across 8 dashboards
Incident data was scattered across multiple dashboards, often mixed with already resolved cases, making investigations inefficient.
03 No live updates
The system relied on static reports with no live data updates, making it difficult for teams to respond to incidents quickly.
AFTER
01 AI-ranked alert prioritization
The system surfaces relevant anomalies and prioritizes critical incidents, helping support agents quickly understand what requires attention.
02 Unified investigation workspace
Incident data from multiple dashboards was consolidated into a single operational view, allowing teams to investigate issues without switching between tools.
03 Real-time incident monitoring
Live data updates and AI powered search enable support teams to track incidents as they evolve and respond faster to critical events.
PROTOTYPE
For the full prototype, reach out via the contact button above.
TESTING INSIGHT

Test 1
Parallel Design
3 / 6 users found it cluttered
→ Switched to scrollable layout

Test 2 - Follow-up
Scrollable Design
5 / 6 users preferred faster scanning
RESULTS & IMPACT
Measurable Global Vaccine Operations
This redesign transformed incident investigation into a single AI-assisted workflow. Eight fragmented monitoring tools were consolidated into one unified workspace used by support and engineering teams.
30 min → 3 min
Faster incident response
8 → 1
Dashboards unified
50%
Faster onboarding
WHAT I WOULD DO DIFFERENTLY
I reduced investigation time.
I didn't solve why agents were leaving
The system got faster. The churn problem was deeper than the interface.
70%
Churn — Unsolved
Investigation time: 30 min → 3 min. ✓
Agent churn within year one: 70% → unchanged.✗
Faster triage doesn't help agents who quit before they learn the system. A parallel onboarding workstream would have addressed the root cause more completely.
0
Incidents predicted before escalation
Every alert in v1 is a reaction to something that already broke. The next version should catch failure patterns before operators have to respond not just help them respond faster.